The Texas Primaries: Hispanic Voters, Turnout, and What It Means for November
.png)
Polls leading up to the Democratic primary were all over the place, to the point they might as well have been describing different races. Topline numbers ranged from Crockett +18 to Talarico +12. Estimates of the Hispanic vote swung wildly, from Crockett winning them by 19 points to Talarico winning them by 29, as documented by Adam Carlson.
This primary election also arrived at a moment of growing dissatisfaction with Trump. National polling showed his approval at an all-time low leading up to Election Day. An open question heading into March 3 was whether that softness would show up in the results, particularly among Latinos.
At the start of the race, it was clear most Black voters would support Crockett and most White voters would support Talarico; the wildcard was where Latinos would go. In the end, Hispanic voters acted as a key factor in the Senate primary, helping James Talarico win the Democratic nomination.
This result isn’t a historic change in racial or electoral dynamics: it is how campaigns have and will continue to work when most of the electorate is locked in and a segment – in this case, Latinos – remains open to persuasion. Notably, Latinos will also be the most dynamic part of the electorate in key congressional races in 2026, and this year’s map is especially Hispanic.
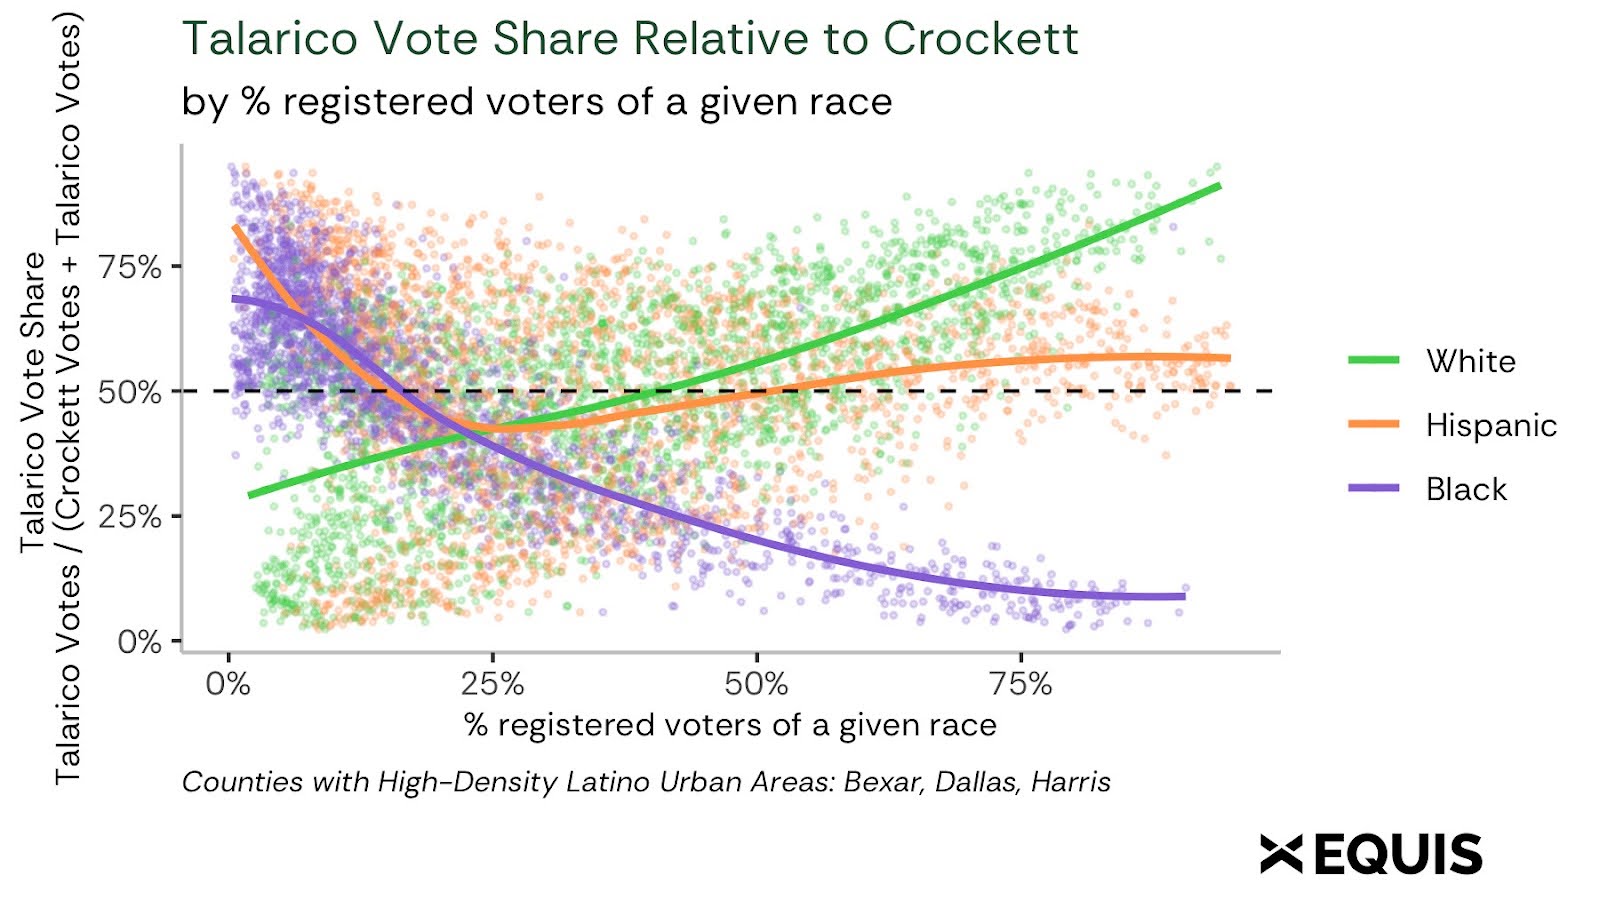
Digging into the primary results, in urban counties (Bexar, Dallas, and Harris), 54% of voters in majority Latino precincts voted for Talarico. Majority white precincts decidedly broke for Talarico whereas majority Black precincts broke for Crockett as expected (Figure 1). In counties that overlap with competitive congressional districts (Bexar, El Paso, and Hidalgo), Talarico’s margin in majority Latino precincts was wider still (62%).
At the regional level, Talarico decidedly carried the Rio Grande Valley1 (RGV) with 67% of the vote share relative to Crockett and the Upper Rio Grande region near El Paso with 63% (see Table 1).
The Republican primary picture is less clear-cut. In majority Hispanic regions, Cornyn led Paxton with 52-55% of the two-way vote. In urban areas, though, voters in majority Hispanic precincts actually favored Paxton (51%) at greater levels than voters in other precincts (45%).
.jpg)
Overall turnout hit a historic high. Predictably, it has become a Rorschach test. Some commentators see evidence of Republican realignment. Others see a coming Latino surge for Democrats. Both readings deserve skepticism.
Primary turnout is a poor forecasting tool. In any given year, one party’s primary may be more competitive than the other’s. That makes cross-party comparisons unreliable. This is true everywhere, but there are additional factors at play in the most heavily Latino parts of Texas, where Democratic primaries also often function as de facto general elections for local offices. Many voters in those areas participate in the primary but skip the statewide general election contest entirely.
Consider Zapata County in 2022. Only 101 people voted in the Republican gubernatorial primary; 2,526 voted in the Democratic one. In November of that year, 1,817 people voted for Abbott (18x the Republican primary number), while only 1,585 voted for O’Rourke, about 1,000 fewer than the Democratic primary total. Primary participation, taken in isolation, told you almost nothing about November. In Texas, county-level shifts in a party’s share of primary voters in 2018-2022 are only somewhat correlated with shifts in that party’s general election vote share, and that relationship is even weaker for majority Latino counties.2
What can we say? Statewide, Democratic turnout in the Senate contest was 2.2x higher than in the 2022 gubernatorial primary; Republican turnout was 1.1x higher. Latino turnout also rose, but Democratic gains in the South Texas border corridor were more modest than elsewhere (see Table 2). In the RGV, Upper Rio Grande, and South Texas, Democratic increases fell below the statewide average while Republican increases ran somewhat higher. That said, despite the outsized attention this region receives in narratives about Texas Latinos, the vast majority of registered Latino voters live elsewhere. In Bexar, Dallas, and Harris counties, home to roughly a third of all Texas Latino voters, turnout increased at roughly equal rates across majority Latino and non-Latino precincts within each party — a notably different pattern than the border corridor's underperformance in Democratic turnout.
As far as we can tell, there does not seem to be one consistent turnout story for Texas Latinos. And as noted above, we warn against reading too much into any of these numbers.
.jpg)
We cannot say with confidence why Talarico performed so well with Latino voters. But there is plenty for other campaigns to study. He communicated directly in the language and values of the communities he courted. He had trusted messengers validating him. He reframed the economic debate as top-versus-bottom rather than left-versus-right. And he welcomed former Trump supporters rather than ignoring or denigrating them.
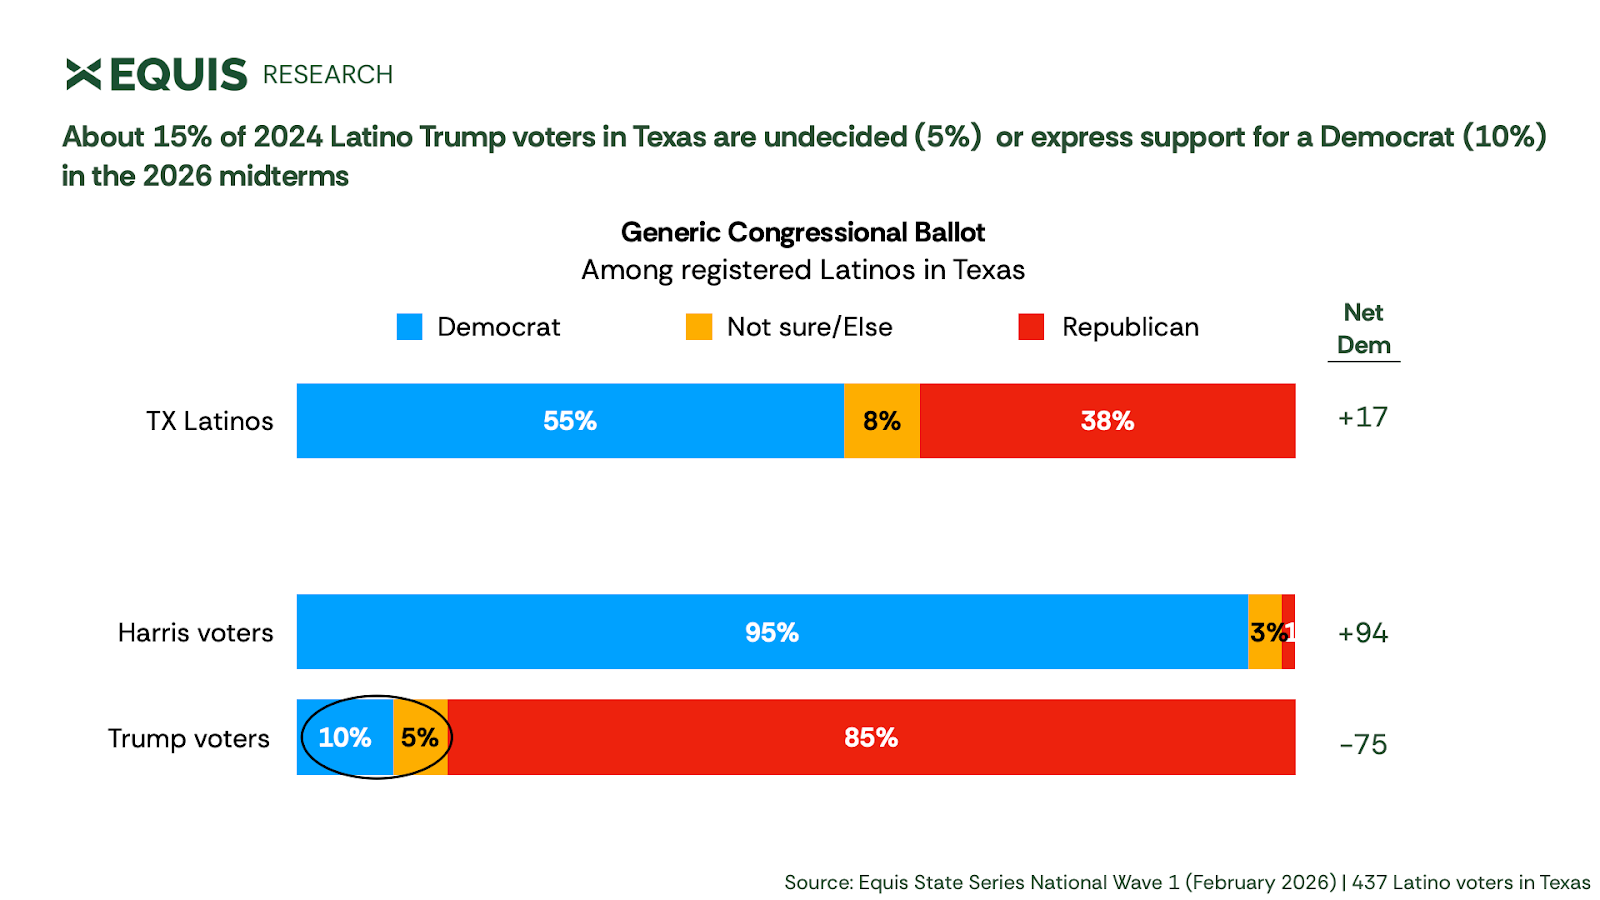
The Texas primary data alone is too noisy to understand how Trump’s low approval may hurt Texas Republicans in November. However, in the most recent Equis poll – which came out of the field just under a month before this primary – we see warning signs for Republicans. Only 85% of 2024 Latino Trump voters in Texas expressed support for a Republican congressional candidate in 2026 (Figure 2), and 10% outright supported a Democrat.
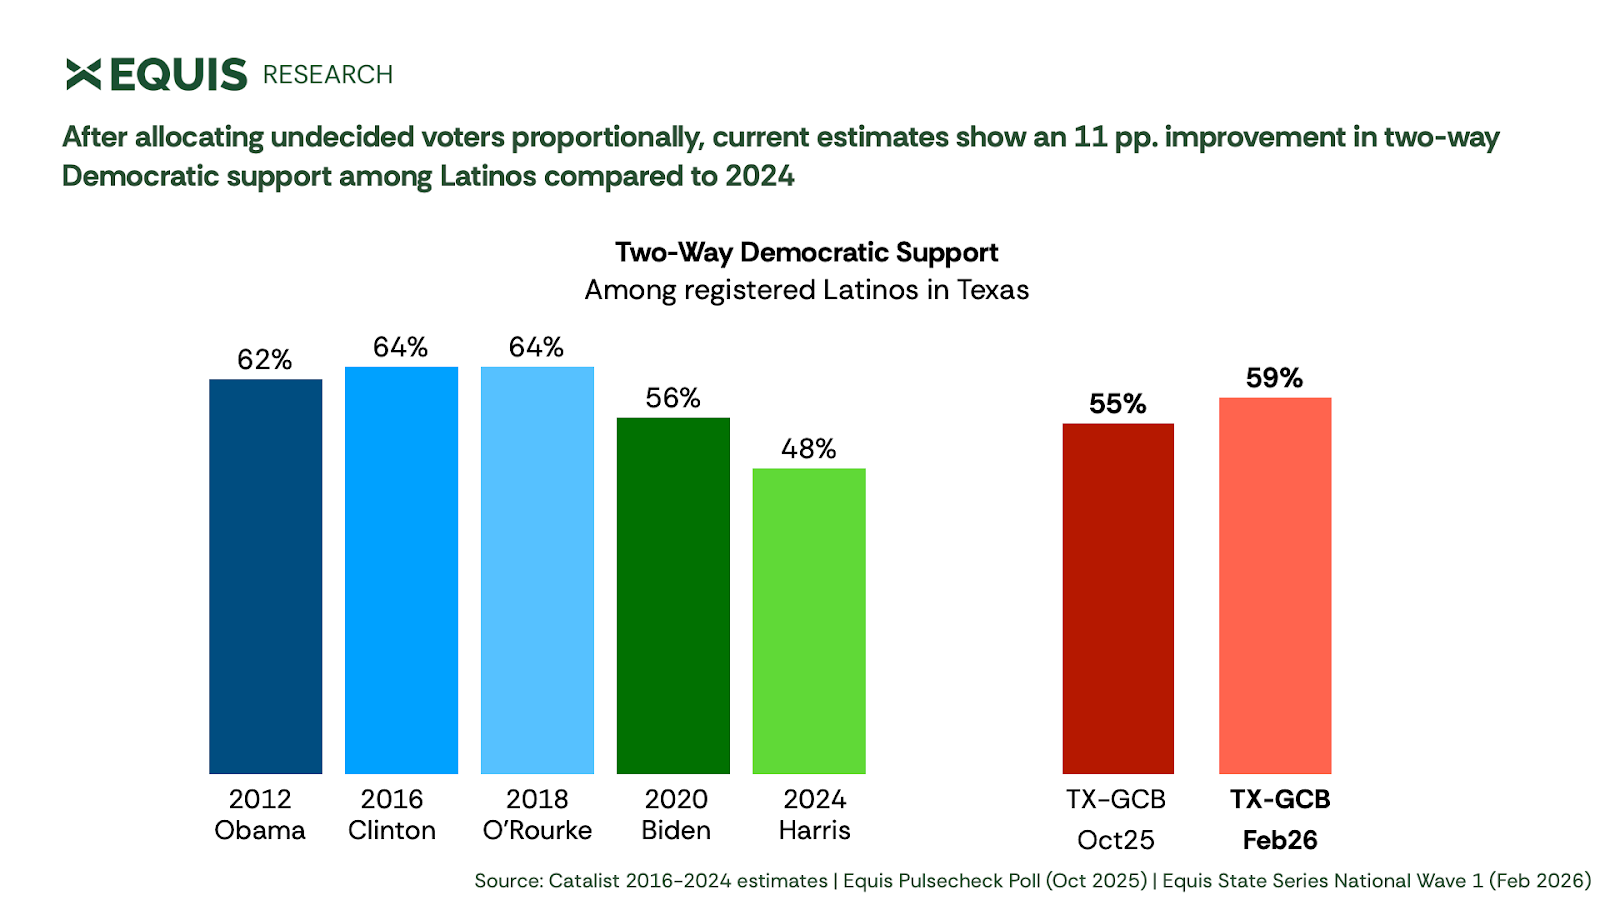
The central question for 2026 is whether Latino support for Democrats will look more like the 2022 midterms (a year when the GOP held gains among Latinos but failed to build on them) or 2018 (a high-water mark for Democrats in the Trump era). What we can say from all available data, including Equis polling, is that Latinos are supporting Democrats at rates higher than the 2024 nadir (Figure 3). They have not yet returned to previous highs. The outcome of several critical races – in Texas and across the country – will depend on making gains among Latinos, many of whom are disappointed with Trump and Republicans but remain skeptical of Democrats. They are up for grabs.
A final note on polling: many of the dynamics that confounded pollsters in this primary will repeat in a midterm. Past vote history will not perfectly predict who turns out. Methodological adjustments that worked in 2024 (like weighting on vote recall) may mislead when applied to a different electorate. The lesson is familiar but worth repeating: treat any single poll with caution, especially now.
Precinct analysis. Precincts are the smallest geographic unit at which election results are reported. We group them by characteristics (such as percent Latino population) to estimate how segments of the electorate voted. This supplements polling data with actual election-night results on turnout and candidate support.
County-level analysis. Unlike precincts, county boundaries are stable over time, allowing direct year-over-year comparisons. We can ask, for example, how 2026 primary turnout in majority Hispanic counties compares to 2022. That comparison is harder at the precinct level because counties frequently redraw precinct lines.
Reading the charts. Each dot represents a single precinct. The horizontal axis shows percent Hispanic population. As you move right, you see how more densely Hispanic geographies voted. This lets us compare election results in Hispanic areas to those in the rest of the state.
Texas Regions and Corresponding Counties
.jpg)
1 The Rio Grande Valley region is defined as Cameron, Hidalgo, Starr, and Willacy counties; see Table 3 in the Appendix for a full list of counties in each region.
2 On average, every 1 pp shift in Dem primary share from 2018 to 2022 in Texas corresponded to a 0.22 pp shift in the same direction in the general election (p < 0.001). In majority Latino counties, the association was weaker (0.10 pp) and not statistically significant.
We work toward a more sophisticated understanding of the experiences, issue preferences, and political identities of Latino and Hispanic voters.

Equis is a set of organizations working to create a better understanding of Latinos, innovate new approaches to reach and engage them, and invest in the leadership and infrastructure for long-term change and increased engagement.